
Australia EV Charging- New Landscape
Introduction
The global shift towards sustainability has propelled electric vehicles (EVs) to the forefront of modern transportation solutions and one of the measures to gauge sustainability level. In Australia, the government has set an ambitious target of achieving 50% of new car sales being Zero Emission Vehicles (ZEVs)[1] by 2030, signalling a strong support for the electrification of the vehicle fleet. While this ambition aligns with global sustainability goals, it brings forth a critical challenge: the disparity between the growing number of EVs and the availability of charging infrastructure. Despite significant strides in EV adoption, the growth of EV charging networks in Australia has lagged.
This imbalance threatens to undermine consumer confidence and impede progress towards national decarbonisation targets. At the same time, the evolving EV ecosystem presents untapped opportunities for charging companies to go beyond their traditional role, leveraging technologies and innovative business models to address infrastructure sufficiency while creating additional value. This research investigates the challenges and opportunities surrounding EV charging infrastructure in Australia. It examines the gap between EV adoption and infrastructure growth, uncover current EV charging solution offerings and corresponding business models, explores revenue diversification strategies such as carbon credit generation and charging stations advertisement, and evaluates the potential of data monetisation to enhance operational efficiency. By addressing these issues, this study aims to offer actionable insights for both policymakers and industry stakeholders, paving the way for a sustainable and efficient EV charging ecosystem.
[1] According to Victoria State Government, Zero emissions vehicles (ZEVs) do not use petroleum fuels and therefore do not emit greenhouse gas emissions from the tailpipe. Battery electric vehicles and hydrogen fuel cell electric vehicles are examples of these technologies.
Imbalance between EV and EV Charging
In recent years, EV adoption has always been high on the agenda of the Australian government, which sets a target to achieve 50% of new car sales to be ZEV (Zero Emission Vehicles) by 2030. The ambition is definitely a positive signal to sustainability promotion within the country. The next question we should be asking is “How are we going to achieve it?”. Switching from petrol to EV, consumers are normally considering a few factors, one of which, is the sufficiency of EV charging infrastructure. While driving petrol car, consumers never get bothered by the maximum distance the car can travel because petrol stations are easily accessible in every part of the country. In contrast, EV charging infrastructure does not provide such a confidence to the potential EV buyers due to its lack of presence.Based on the figures from the Australian Automobile Association (AAA), the rolling quarterly EV sales share in 2023, it is observed that the EV sales share grew from 7.34% in Q1 2023 to 8.45% in Q3 2023. In 2024, the EV sales share continued to rise, peaking at 9.89% in Q1 before slightly decreasing to 9.53% by Q3. The Q3 share increased YOY by 12.8%, demonstrating a steady market growth for EVs.

Figure 1 Australia EV Sales Share Breakdown, Australian Automobile AssociationAs opposed to the growth in EV sales share, the growth of EV charging infrastructure is relatively sluggish. EV per charger in Australia was about 20.7 EVs per charging point in 2021. Still, by 2023, this figure more than tripled to approximately 65.6 EVs per charging point. Other than EV per charger, kW per EV, an aggregate metric that considers both the number of charging stations and the power output, provides insight into the sufficiency of EV charging infrastructure in terms of the power supplied to each EV. Australia's kW per EV dropped from 2.16 in 2021 to 0.62 in 2023, which is below EU AFIR standard of 1.3 kW per EV. These two figures also highlights Australia's lack of EV charging infrastructure.

Figure 2 Charger per EV, IEA, Global EV Outlook 2024, IEA, Paris https://www.iea.org/data-and-statistics/data-product/global-ev-outlook-2024, Licence: CC BY 4.0
Figure 3 kW per EV, IEA, Global EV Outlook 2024, IEA, Paris https://www.iea.org/data-and-statistics/data-product/global-ev-outlook-2024, Licence: CC BY 4.0
Reasons for slow EV charging pick-up pace
To promote vehicle fleet electrification, several EV charging incentives programmes in both federal and state levels, such as Driving the Nation Fund by the federal and EV Fast Charging Grants by NSW government, were launched and EV charging point was supposed to grow with market demand. Conversely, as mentioned earlier, the pace of EV adoption in Australia is far outstripping the expansion of charging infrastructure. This opposite behaviour should not be attributed to the lack of government incentive policy, but rather the reasons mentioned in JET Charge's "Charging as a Service – Lessons Learnt Report #1"
Lack of Marketing & Communication
As opposed to EVs, which are widely discussed among people, EV charging, as an accessory, is not adequately informed to the general public, especially regarding the cost of charging and the importance of associated energy management. The industry faces significant challenges in marketing and communication, which impede its growth and the widespread adoption of EVs and EV charging.
According to the report, fleet managers increasingly view the upfront costs and complexities of charging infrastructure as significant barriers to EV adoption. This perception underscores the necessity for effective marketing strategies to educate potential customers about solutions like Charging as a Service (CaaS), which aims to address these concerns. JET Charge acknowledges that, as a technology-driven organization, it must enhance its marketing capabilities to communicate the benefits of its CaaS model effectively. Initial efforts have yielded minimal customer inquiries and low engagement, highlighting the critical need for improved marketing and communication to drive fleet electrification at scale.
Complexity in Public Charging Infrastructure
Deploying EV charging infrastructure in commercial buildings presents significant challenges, as highlighted in the “JET Charge – Charging as a Service – Lessons Learnt 1”. It emphasizes that most commercial buildings can accommodate only a limited number of AC chargers without requiring expensive upgrades to their electrical systems. These upgrades often involve enhancing electrical capacity, such as transformers or electrical panels, which contribute to high costs and lengthy lead times for implementation. These barriers can deter businesses from adopting EV charging infrastructure, slowing down the transition to electric vehicles. Additionally, the layout and design of existing commercial spaces are not always conducive to accommodating EV chargers, particularly in older buildings where retrofitting for charging stations can be logistically complicated. Parking spaces may not be located near electrical infrastructure, adding costs for trenching and cabling. Businesses may struggle to justify these expenses if the perceived demand for charging facilities is low among tenants or employees. This situation creates a paradox that the lack of accessible infrastructure deters EV adoption by businesses while the slow growth in EV usage discourages investments in charging infrastructure. Nonetheless, this weakness is deemed to be solvable both operationally and technologically by the methods discussed in the following sections.
Current business-growing strategy
With reference to “EV Charging Infrastructure: The next frontier”, published by Deloitte, home charging serves 95% of the charging needs for approximately 70% of Australians residing in detached dwellings while public charging fully satisfies the needs of the rest. This market segmentation, coupled with the barrier of expensive upfront upgrade costs aforementioned, motivated EV charging companies in Australia, such as Schneider Electric, I-Charge, and JET Charge, to offer pain-point-focused solutions and adopt corresponding business models so that they can secure both short-term and long-term revenue streams from the market and grow public EV charging facilities number.
Pain-Point-Focused Solutions
Understanding the end-to-end user’s journey and collecting pain points embedded in the process are always the prerequisites of devising an efficient solution which creates value to customers in terms of effort, time, and capital.
Referencing from I-Charge, one of the eight EV charging companies globally granted OCPP2.0.1 Core and Advance Security certification, the below table summarises the corresponding solutions to each pain point faced by EV charging customers.

Current business-growing strategy
Dynamic Business Model
Commercial/Public Charging - Zero Capex Model
With available value-adding solutions, a business can start adopting suitable business models to capture corresponding markets. In the commercial/public charging sector, I-Charge adopted Zero Capex Model, under which, the charging point operator bears all the upfront installation and maintenance costs, while the property owner is not required to invest any capital. EV owners using the public charging service within the property are charged roughly AUD$0.6 per kWh, which already incorporates both electricity and parking fees. The features of the Zero Capex Model are summarised as follows.

Home Charging - One Time Fee Revenue Model
In the home charging sector, customers usually install level 1 or 2 EV chargers to charge their own EVs. While some customers may request additional services, such as installing solar panels and batteries, the sales revenue in the sector mainly consists of the purchase and installation fees of the charger itself. Therefore, I-Charge chooses the Time Fee Revenue Model for this short-term revenue in the home charging sector. The features of the Hybrid Revenue Model are summarised below.

Industry sales forecast under current strategy
Assumptions
Under the current business setup, it is wondered how much sales revenue the EV charging industry in Australia will attain from 2024 to 2030, when is the target year for the “50% of new car sales to be ZEV”. Using the data from International Energy Association (IEA) as well as Australian Automobile Association (AAA), a scenario-based forecast methodology containing “Best”, “Base”, and “Worst” cases can be generated with the following assumptions.
1.Constant ratio of home charging to commercial/public charging from 2024 to 2023 = 30:70 based
on Deloitte paper
2.Constant annual energy consumption per EV = 2000kWh per year
3.Constant annual total new car sales no. from 2023 to 2030 = 1,162,000 (from AAA)
4.EV car sales share in 2024 is assumed to be 9.53%, same as the YTD EV car sales share as of 2024 Q3
5.EV car sales share in 2030:
a.Best = 50% with CAGR = 32% (Australia government strategic target)
b.Base = 29.9% with CAGR = 21% (Assuming constant YOY growth rate from 2022 to 2023)
c.Worst = 9.53% with CAGR = 0% (Assuming zero growth)
6. Constant commercial/public charging rate per kWh = AUD$0.6/kWh from 2024 to 2030
7. Constant home charger sales revenue = AUD$1500 per charger from 2024 to 2030
8. Total sales revenue = Commercial/Public Charging Revenue + Home Charging Revenue
9. Commercial/Public Charging Revenue = EV Stock x Ratio of Commercial/Public Charging x Annual
Energy Consumption per EV x Commercial/Public Charging Rate per kWh
10. Home Charging Revenue = EV Car Sales x Ratio of Home Charging x Home Charger Sales Revenue
Forecast Result

Industry sales forecast under current strategy
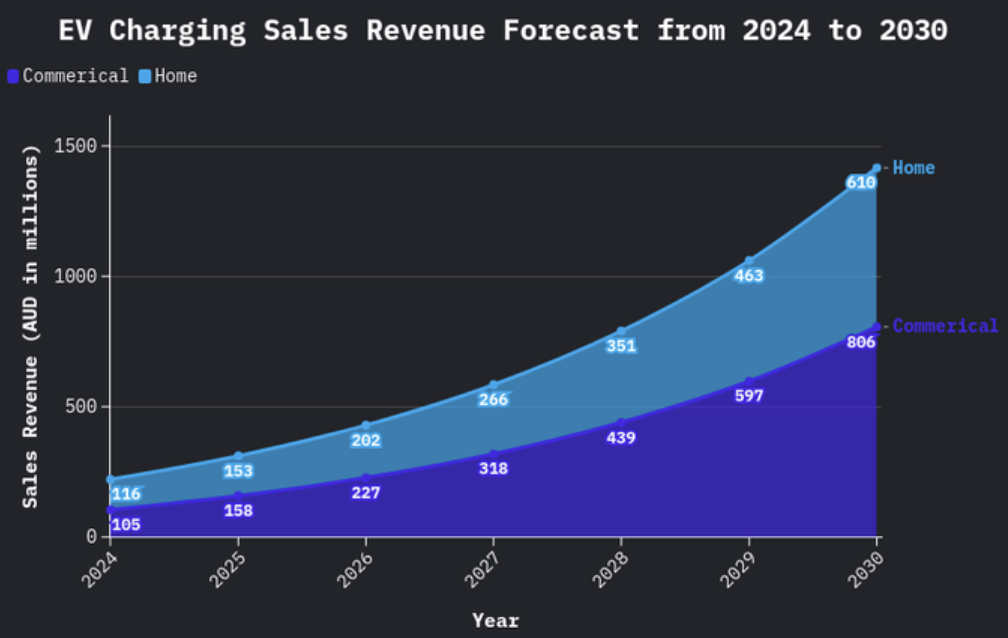
Forecast Result
In the "Best "situation, 50% of car sales will be EV in 2030; EV stock will reach roughly 2.2 million by 2030 while EV sales number sits at 581,000. The total sales revenue in Australia's EV charging industry amounts to AUD$1,416 million, with 57% coming from commercial/public charging sales and the rest from the home charging sector. In the "Base" case, EV sales are assumed to grow at the same rate from 2022 to 2023, meaning that EV sales will reach roughly 347,000 in 2030. The total sales revenue in the industry is estimated to be AUD$961 million in 2030. Regarding the "Worst" scenario, which is assumed to stay at the 2024 Q3 EV sales share level, the EV sales will be approximately 110,000 in 2030, pushing the EV stock to 956,000. The sales revenue for the whole will still reach AUD$460 million[2].
Interpretation
In all three cases, the commercial/public charging sector contributes to the majority of the sales revenue in the industry even though this sector only serves 30% of the population owning an EV. This implies that the long-term success of an EV charging company highly depends on its business in running commercial/public charging. More specifically, commercial/public charging accounts for 57%, 62%, and 75% of the total industry sales revenue in “Best”, “Base”, and “Worst” scenarios, respectively. It indicates that the importance of commercial/public charging to the sector overall sales revenue grows higher when the adoption pace is slower. This further confirms the belief that commercial/public charging business performance is a critical area in which to gauge the profitability of an EV charging company.
Limitations
The method used in the projection assumes a constant ratio of home charging to commercial/public charging, which makes it insensitive to the change of EV owners’ charging location preference, meaning that the figure can be either inflated or deflated. Moreover, the constant fee structure neglects any inflation effect, leading to lower sales revenue. More importantly, the EV sales share CAGR is considered solely based on a government strategic target, which neglects contributing factors like the level of total disposable income, EV charging infrastructure development, government EV incentive programmes, etc. These factors ultimately lead to a different EV sales share and CAGR, making the figures vary from the prediction.
Further Study
The projection of industry annual sales revenue can be complemented with the valuation of EV charging companies to delve into the investment opportunity within the industry. Since most EV charging companies are privately owned, an income-based approach, including the free cash flow method (assuming a positive FCF and going concern), can be utilised to value an EV charging company after getting the forecasted company sales by multiplying the specific market share.
[2] Detailed forecast result is presented in the Appendix section
Opportunity in carbon credit generation
ACCU as an alternative income source
Other than the income generated by core business operation, carbon credit is also deemed as an alternative income stream for EV charging companies. In Australia, Australian Carbon Credit Unit (ACCU) scheme, administered by the Clean Energy Regulator, supports projects to reduce carbon emissions or store carbon across Australia. Eligible projects using new technology, upgrading equipment, or changing business practices to improve productivity or energy use can earn one ACCU for one tonne of carbon dioxide equivalent (tCO2-e) that would have otherwise been released into the atmosphere. ACCU can be then traded at a price determined by the supply and demand in the carbon market where private buyers buy ACCUs to voluntarily offset their carbon footprint or meet their obligations from emission reduction.
How do EV charging companies generate carbon credit?
Before discussing the ways EV charging companies used to generate carbon credit, it is essential to understand when they can create this opportunity. Carbon emissions are generated throughout the lifecycle of a vehicle which can be broken down into vehicle manufacturing, fuel lifecycle, and end of life. Carbon emissions reduction from petrol vehicles to EVs mainly occurs in the stage of fuel lifecycle. According to an article from Electric Vehicle Council[3], during the fuel lifecycle, the average medium- sized BEV powered by grid electricity from National Electricity Market (NEM) is 11 tCO2 while the average medium-sized BEV powered by solar PV is only 2 tCO2. This implies that EV charging companies can generate 9 tCO2 for each EV, equivalent to AUD$309.06 based on the volume weighted average spot price on 28th Jun 2024, over its lifetime if they fully power EV charging by using renewable energy methods. trading income for EV charging companies. With an increasing number in EV, the carbon credit generation rate accelerates and the income coming from this stream will eventually occupy a significant portion of EV charging companies revenue.

Figure 4 Lifecycle emissions of Medium Car Driven in Australia in tonnes CO2, Electric Vehicle Council
[3] Sourced from “A comparison of lifecycle emissions between BEVs and ICE vehicles in Australia”
From Paid-to-Charge to Charge-to-Earn
Reimagining the possibility of EV charging
With a strategic planning on EV uptake from the government and people’s increasing concern about sustainability, EV number is almost surely surging in the upcoming years. EV charging, as an accessory to EV, can definitely benefit from the trend. However, if an industry wants to grow further, it must create additional value to the customers, so as the EV charging industry. “Is EV charging simply a process of charging EV battery to a sufficient level so that EV owners can drive their cars?”, the answer of which, can be the key for EV charging companies to go beyond the current scope and grow their businesses.
Not just a charging station
Public/commercial charging stations can be used as an advertisement panel. To charge their EVs, EV owners must spend minutes at the charging station. When they pick up the charger or check out, they are easily exposed to information presented on the EV charging station. Taking the advantage of this exposure, EV charging companies can install digital advertisement panels on the charging stations or charging pillars. This serves as a channel for companies to promote their businesses while EV charging companies can also make a profit from it.
Data Monetisation
Data has recently become one of the most valuable assets on the planet given the importance of data- driven decision-making process. With the advancement in communication protocol, such as OCPP2.0.1, EV charging goes beyond simple battery charging. It is now capable of collecting information from both EV chargers and EV itself during the charging period. The data collected becomes a valuable asset to both EV owners and EV charging companies. The former will no longer pay to charge but charge to earn while the latter facilitates the development of charger and grip distribution.
EV owners:
Insurance companies: Uber/DiDi drivers, who use EVs as their passenger vehicles, are required to enter an insurance policy for third-party or property. The vehicle data collected during charging is used by insurance companies to evaluate vehicle status which is one of the important inputs for insurance premium pricing. By selling this information to insurance companies, EV owners can enjoy a discount on insurance premiums, similar to giving walking distance information of an individual in exchange for premium discounts.
EV charging companies:
Charger manufacturer/Academic researcher: Data from chargers includes error status, component status, operating lifespan, etc. This type of information is important when it comes to the innovation and invention of new generation chargers. Charger manufacturers and academic researchers perceive the data a critical part of their development and research.
Power plant: Data on energy consumption patterns allows companies to better integrate with renewable energy sources and implement smart grid solutions. Power plant can leverage this information to dynamically adapt to the electricity demand for a better cost control.
Conclusion
Though the EV uptake figures of Australia is not catching up with its Paris Agreement participant peers, the increasing adoption rate of electric vehicles in Australia signifies a crucial step toward sustainability and decarbonization. However, the paradox of whether EV charging facilitates EV adoption or EV adoption creates the demand for EV charging created the imbalance between EV adoption and charging infrastructure development, thereby erecting a barrier to EV uptake. To achieve the government’s ambitious targets, policy incentives associated with strategic efforts, such as marketing of EV charging benefits, are needed to accelerate the growth of EV charging networks.
Apart from the effort made by the government, industry participants also need to fully understand the end-to-end user journey whereby EV charging companies can develop pain-point-oriented solutions, including solar-PV-powered charging system and dynamic loading management system, to achieve the optimal projected AUD$1,416 million industry sales revenue by 2030. In addition, innovative approaches, such as leveraging carbon credits through renewable energy usage and enhancing infrastructure efficiency, are critical to secure alternative income stream and attract users.
Beyond infrastructure expansion, EV charging companies can unlock additional value by reimagining the potential of charging stations. By utilizing them as advertising platforms and embracing data monetization, these companies can diversify revenue streams while delivering enhanced value to customers. The ability to gather and monetize data also enables collaboration with industries like insurance, energy, and research, thereby driving innovation and cost efficiency across sectors.
As EV numbers continue to surge, the EV charging industry must evolve beyond its current scope. Byintegrating renewable energy, enabling data-driven solutions, and creating multifaceted value propositions, EV charging companies can not only meet the growing demand but also establish themselves as essential players in the transition to a sustainable future. The path forward lies in transforming EV charging from a simple utility to a dynamic ecosystem that benefits consumers, businesses, and the planet alike.


-
We are grateful for Prof. Deep Kapur and the team at Monash Centre for Financial Studies (MCFS) for their unwavering support on a student-led initiative and the delivery of our agenda in multiple of ways and acknowledge their contributions to each and all releases. We also remain deeply grateful to the Faculty of Banking and Finance at Monash Business School for continuous support in facilitation of MSMF and our agenda.
We would also like to acknowledge Warrick Mak (Chief Knowledge Officer) at i-Charge Global for providing oversight into this research paper, providing the entire research with input and valuable information from an industry perspective.
-
This material is a product of Monash Student Managed Fund (MSMF) and is provided to you solely for general information purposes. I understand that the information in these documents is NOT financial advice. Before making an investment decision to acquire shares, you should consider, preferably with the assistance of a financial or other professional adviser, whether an investment is appropriate in light of your own personal circumstances. If you can, you should obtain a copy of the Information Memorandum of the company that you are seeking to invest in, and consider their risks and disclosures. Subject to the Australian Consumer Law, Corporations Act, the ASIC Act, and any other relevant law, MSMF does not accept any responsibility for any loss to any person incurred as a result of reliance on the information, including any negligent errors or omissions. This information is strictly the personal opinion of an MSMF member and does not represent the views of MSMF. This information constitutes factual information that is objectively ascertainable such that the truth or accuracy of which cannot reasonably be questioned. MSMF does not intend to advertise any stock or financial product whatsoever. Past performance is not a reliable indicator of future performance. Past asset allocation and gearing levels may not be reliable indicators of future asset allocation and gearing levels. Performance data is just an estimation based on public market data and may not be a true reflection of actual fund performanceon text goes here
-
Australia Government, Department of Climate Change, Energy, the Environment and Water. (2023). National Electric Vehicle Strategy. Retrieved from https://www.dcceew.gov.au/sites/default/files/documents/national-electricvehicle-strategy.pdf
Australia Government, Department of Climate Change, Energy, the Environment and Water. (n.d.). Driving the Nation Fund. Retrieved from https://www.dcceew.gov.au/energy/transport/driving-the-nation-fund
Australian Automobile Association (AAA). (2024, November). Electric Vehicle Index. Retrieved from https://www.aaa.asn.au/research-data/electric-vehicle/
Australian Capital Territory Government. (2024, August). Rebates available for businesses to install EV chargers. Retrieved from https://www.act.gov.au/our-canberra/latestnews/2024/august/rebates-available-for-businesses-to-install-ev-chargers
Australian Government, Clean Energy Regulator. (2024, September). Quarterly Carbon Market Report: June Quarter 2024. Retrieved from https://cer.gov.au/markets/reports-and-data/quarterly-carbon-market-reports/quarterly-carbon-market-report-june-quarter-2024/australian-carbon-credit-unitsaccus
Baumgurtel, M., & Ryan, W. (2024, September). Can Hydrogen Fuel Cell Vehicles Compete with Electric Vehicles in the Light Passenger Vehicle Market? Retrieved from https://hamiltonlocke.com.au/can-hydrogen-fuel-cell-vehicles-compete-with-electric-vehicles-in-the-light-passenger-vehicle-market/
Cardinal, E. (2024, February). How Much Does It Cost to Charge an Electric Car in 2024? Retrieved from https://www.drive.com.au/caradvice/how-much-does-it-cost-to-charge-an-electric-car-in-australia-2/
Deloitte. (2024, January). EV Charging Infrastructure: The Next Frontier. Retrieved from https://www.deloitte.com/au/en/Industries/infrastructure/analysis/ev-charging-infrastructure-next-frontier.html
Electric Vehicle Council. (2024). A Comparison of Lifecycle Emissions Between BEVs and ICE Vehicles in Australia. Retrieved from https://electricvehiclecouncil.com.au/wp-content/uploads/2023/11/EVC-Lifecycle-Emissions-Calculator-Explainer.pdf
Government of South Australia. (n.d.). Statewide EV Charging Network. Retrieved from https://www.energymining.sa.gov.au/industry/hydrogen-and-renewable-energy/electric-vehicles/statewide-ev-charging-network
Government of Western Australia. (2024, October). Charge Up EV Charging Grants. Retrieved from https://www.wa.gov.au/organisation/energy-policy-wa/charge-ev-charging-grants
Hatfield-Dodds, D. S., & Boulus, P. (2023, September). Australia’s Carbon Market Is Changing Gears: Are You Ready? Retrieved from https://www.ey.com/en_au/insights/sustainability/australia-s-carbon-market-is-changing-gears-are-you-ready
Honda. (2024). All-Solid-State Battery Technology. Retrieved from https://global.honda/en/tech/All-solid-state_battery_technology/
I-Charge. (2024). I-Charge Case Studies. Retrieved from https://i-charge.global/case-studies/
International Energy Association (IEA). (2024, April). Global EV Outlook 2024. Licence: CC BY 4.0. Retrieved from https://www.iea.org/data-and-statistics/data-product/global-ev-outlook-2024
Jet Charge. (2023, December). JET Charge – Charging as a Service – Lessons Learnt 1. Retrieved from https://arena.gov.au/assets/2024/01/JET-Charge-Charging-as-a-Service-Lessons-Learnt-1.pdf
New South Wales Government. (2024, November). Fast Charging Grants. Retrieved from https://www.energy.nsw.gov.au/business-and-industry/programs-grants-and-schemes/electric-vehicles/electric-vehicle-fast-charging
Noodoe. (2023, March). "Powered by Noodoe" Partnership: Evansa and Noodoe Launch First-Ever Carbon Credit Generating DC Charger in the Land Down Under. Retrieved from https://www.noodoe.com/press/powered-by-noodoe-partnership-evansa
Northern Territory Government. (n.d.). Electric Vehicle Charger (Residential and Business) Grants Scheme. Retrieved from https://nt.gov.au/industry/business-grants-funding/electric-vehicle-charger-residential-and-business-grants-scheme
Open Charge Alliance. (2023, March). What Is New in OCPP 2.0.1. Retrieved from https://openchargealliance.org/wp-content/uploads/2023/07/new_in_ocpp_201-v10.pdf
Quarktwin Technology. (2023, April). Differences Between Hydrogen Fuel Cell and Lithium Battery. Retrieved from https://www.quarktwin.com/blogs/battery/differences-between-hydrogen-fuel-cell-and-lithium-battery/51
Queensland Rural and Industry Development Authority. (2024, October). Electric Vehicle Charging Infrastructure Scheme. Retrieved from https://www.qrida.qld.gov.au/program/electric-vehicle-charging-infrastructure-scheme
Renewables, Climate and Future Industries Tasmania. (n.d.). e-Transport Support. Retrieved from https://recfit.tas.gov.au/what_is_recfit/climate_change/electric_vehicles/support
Victoria State Government. (2024, July). Destination Charging Across Victoria Program. Retrieved from https://www.energy.vic.gov.au/grants/destination-charging-across-victoria-program

Author
Alden LIU- Research Associate
Alden Liu is currently a Research Associate in MSMF Institute with a focus area in Electric Vehicles (EV) & Fundamental Investment Analysis, and he is currently pursing a Masters of Financial Mathematics at Monash University.